 keymodels
Financial ratio analysis: liquidity, solvency and profitability ratios
How should financial ratio analysis: liquidity, solvency and profitability ratios be measured and interpreted?
Contents
Financial ratios help to analyse the financial performance of all the activities of an organisation and all its products and services in all markets.
Financial ratio analysis relates figures from financial statements to show liquidity, solvency, profitability and operating efficiency. Ratios make organisations, periods and business units easier to compare, while revealing financial constraints that may affect a proposed strategy.
When to use it
Review ratios as part of regular management reporting and whenever an investment, financing decision or strategic initiative could materially change the financial position.
Use consistent definitions to compare the organisation with its history, plan and relevant peers. Where the underlying data support it, calculate ratios by product, market or business unit—but remember that shared costs and internal allocations can distort those views.
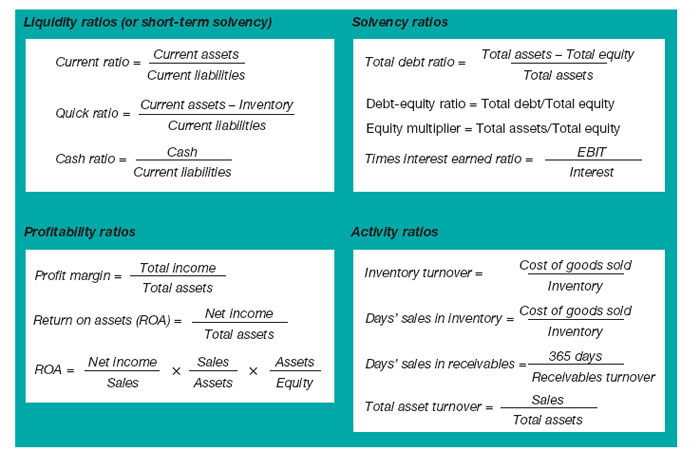
A ratio review helps assess:
- the current financial condition;
- the capacity to meet obligations and attract capital;
- the headroom available for further investment.
Origins
Ratio analysis evolved from double-entry accounting, published financial statements and the needs of lenders and investors rather than from a single inventor. Commercial analysts began comparing balance-sheet and income-statement figures systematically as corporate reporting expanded. In the early twentieth century, the DuPont system demonstrated how linked ratios could decompose return on equity into operating margin, asset use and leverage. Modern analysis retains that comparative logic across a wider set of measures.
What it is
A ratio divides one relevant accounting figure by another to create a normalised indicator. The result is not meaningful in isolation: accounting policies, business model, seasonality, inflation, acquisitions and one-off events can all change comparability.
The main families are:
- Liquidity ratios, which examine near-term capacity to meet obligations.
- Solvency or leverage ratios, which examine longer-term debt capacity and financial risk.
- Profitability ratios, which relate earnings to revenue, assets or equity.
- Activity or efficiency ratios, which examine how quickly working capital and assets turn over.
Together, the measures describe different parts of the same system. Strong profitability can coexist with weak cash liquidity, while high returns to equity may partly reflect greater leverage.
How to use it
Define the decision and comparison set first. Obtain reconciled figures from the financial system, confirm that periods and accounting treatments are consistent, and calculate the selected ratios from documented formulas.
Analyse each ratio across time, against plan and against genuinely comparable organisations. Decompose material changes into their operational and financial drivers. For example, a higher return may come from price, margin, asset utilisation, a changed product mix or additional leverage, each implying a different management response.
Use cash-flow measures and qualitative context alongside the ratios. Stress-test the effect of changes in sales, costs, working capital, interest and financing terms before treating historical performance as evidence of future capacity.
Final analysis
Financial ratios provide a disciplined summary of the organisation’s current position and, under explicit assumptions, the direction in which unchanged policies may lead. They do not choose a strategy. Their role is to expose constraints, trade-offs and financial consequences so leaders can judge a strategic option with market, operational and organisational evidence.
Top practical tip
Build a compact ratio tree tied to the decision. Reconcile every input to the statements, define the formula once and annotate changes caused by accounting policy or one-off events. Trend, plan and peer comparisons then become explainable rather than a collection of disconnected numbers.
Top pitfall
Never interpret a ratio as an absolute verdict. A “good” value depends on industry economics, timing, definitions and risk appetite, and management can temporarily improve some ratios through window dressing. Examine the statements, cash flows and business context, and avoid comparing organisations that account for the same activity differently.
Further reading
Keown, A.J., Scott, D.F., Martin, J.D. and Petty, J.W. (1994). Foundations of Finance: The Logic and Practice of Financial Management. Upper Saddle River, NJ: Prentice-Hall.
Walsh, C. (2008) Key Management Ratios: the 100+ Ratios every Manager Needs to Know. Harlow: Pearson.