 keymodels
Risk–reward analysis
How can risk–reward analysis support strategic choice or positioning?
Contents
The risk–reward analysis charts potential rewards of strategic options against the associated risk.
Risk–reward analysis compares the potential value of strategic options with the uncertainty and downside attached to them. Plotting options on a common view helps leaders decide where to investigate, redesign, sequence or allocate resources. It is inspired by risk–return reasoning in finance but must be adapted carefully for non-traded strategic choices.
When to use it
Use the analysis when several materially different initiatives compete for capital, capacity or management attention. It can support a rapid executive discussion or a detailed process involving market research, return-on-investment estimates, scenarios and sensitivity analysis.
Apply it to individual options and portfolios. A combination may diversify exposure, create dependency or concentrate risk; the simple chart does not model those interactions automatically. Use portfolio scenarios when the options share customers, technology, cash, suppliers or execution resources.
Origins
The method draws from investment portfolio theory, capital budgeting and strategic portfolio analysis. Financial risk–return models compare expected return with the distribution of possible outcomes; managers later adopted similar maps for projects and strategic options. No single canonical origin or formula governs the generic risk–reward chart.
What it is
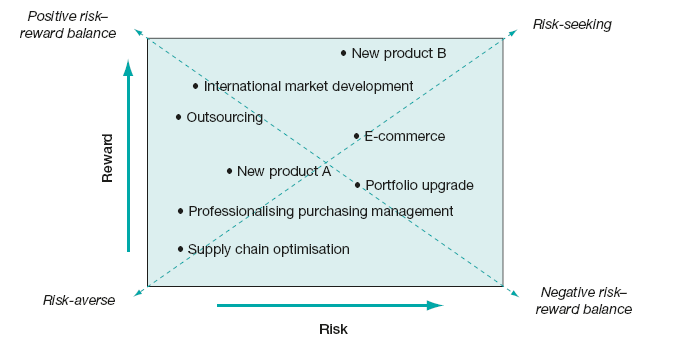
Each option is positioned by a defined reward measure and a defined risk measure. A third visual dimension may represent resource requirement, while colour or shape can show horizon, strategic theme or confidence. The apparent simplicity depends on transparent definitions beneath every point.
How to use it
Define the decision, constraints, risk appetite and time horizon. List feasible strategic options, including the status quo and staged alternatives.
Estimate incremental reward against a counterfactual. Include revenue, savings, avoided loss, capability, option value and strategic outcomes, but keep monetised evidence separate from qualitative judgement. Use ranges and scenarios rather than one expected value when uncertainty is material.
Assess risk across investment exposure, market demand, execution, technology, regulation, supply, people, reputation, exit barriers and opportunity cost. Consider likelihood, consequence, velocity, recoverability and correlation with existing exposures. Record confidence in the estimate.
Plot the options and examine dominance: an option with lower reward and higher risk than another needs a special strategic reason to survive. For high-reward/high-risk choices, look for experiments, phasing, partnerships, caps or exit rights that reduce exposure. For low-risk options, search for ways to increase value without introducing disproportionate complexity.
Add resource demand as bubble size when capacity is a binding constraint. Then build portfolio combinations and test shared assumptions, cash requirements and downside scenarios. Select a portfolio that fits appetite and preserves the capabilities needed to execute.
Document the assumptions, owners, decision gates and early indicators. Replot as evidence changes rather than treating the original chart as a permanent ranking.
Final analysis
Risk and reward are not single objective quantities. They combine evidence, models, values and strategic judgement. Making those inputs explicit allows challenge and learning; hiding them behind precise coordinates encourages overconfidence.
Optimism tends to inflate reward and suppress risk, especially for sponsored initiatives. Independent challenge, reference cases and premortems can counter this tendency. Interdependencies also matter: individually attractive projects can create an impossible combined workload or one concentrated point of failure.
The model is most useful as a conversation and redesign tool. It should narrow and improve options before final capital-allocation analysis, not replace cash-flow valuation, risk limits or execution planning.
Top practical tip
Attach a short evidence card to every plotted option: counterfactual, reward range, downside scenario, resource need, confidence and dependencies. The chart then becomes an index to analysis rather than a collection of unsupported dots.
Top pitfall
Do not average away catastrophic constraints or assume that combining attractive options diversifies risk. Shared technology, customers, funding and key people can make the portfolio more fragile than any point suggests.
Further reading
Sperandeo, V. (1994) Trader VIC II: Principles of Professional Speculation. Hoboken, NJ: John Wiley & Sons.