 keymodels
Strategy maps
How should strategy maps be measured and interpreted?
Contents
A one-page representation of the hypotheses linking learning, internal processes, customer value and financial outcomes.
Kaplan and Norton introduced the balanced scorecard in 1992. After examining many scorecards, they observed recurring cause-and-effect patterns linking intended strategy with the capabilities and processes expected to produce its outcomes. A strategy map makes those hypotheses visible on one page.
When to use it
Use a strategy map to describe strategic objectives across the four balanced-scorecard perspectives and to show how contributions are expected to connect. Combined with indicators, targets and initiatives, it gives management an architecture for steering execution.
The map makes value-creating processes and intangible assets visible. In a knowledge-intensive organisation, skills, information, culture and leadership in the learning and growth perspective enable internal processes. Those processes create the customer value represented in the customer perspective, which should contribute to financial outcomes. The arrows are strategic hypotheses to test, not proof of causality.
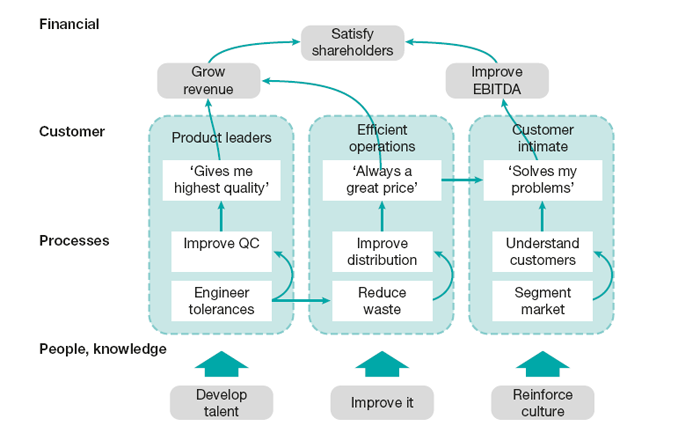
A map also supports translation from broad intent to performance expectations. The linked balanced scorecard can be cascaded into teams and roles, helping people see how their work contributes. Cascade contribution and decision relevance rather than copying corporate measures mechanically to every employee.
Origins
Robert Kaplan and David Norton introduced the balanced scorecard in 1992 as a broader performance-measurement system. As organisations used the scorecard for strategy, the authors observed recurring cause-and-effect connections among objectives in its financial, customer, internal-process, and learning-and-growth perspectives. They articulated the strategy-map approach in a Harvard Business Review article at the start of the new millennium and developed it fully in Strategy Maps. The map made the strategic hypotheses behind a scorecard visible instead of leaving the measures as an unconnected collection.
What it is
A strategy map, described by Kaplan and Norton (2004), represents how intangible assets are expected to enable internal activities that produce customer and financial outcomes. It gives the organisation a cohesive and systematic picture of its strategic logic.
The map normally places learning and growth at the foundation, internal processes above it, customer outcomes next and financial objectives at the top. Strategic themes may cross all perspectives. Arrows state an assumed relationship: if the organisation builds a capability and improves a process, a specified customer and financial result should follow.
How to use it
Begin with an explicit strategy. Express it as a small number of themes, such as growth in a particular segment or improved efficiency in a product group.
Most themes initially describe work in the internal-process perspective. For each theme, reason downward to the learning, technology, culture or organisational capability required. Then reason upward to the customer result the process must create and the financial result expected from that customer value.
Challenge every link. Ask what evidence supports the relationship, what time lag is plausible and what else could affect the outcome. Remove objectives that do not contribute to a theme and identify missing dependencies.
Use the completed map to build the balanced scorecard. Derive indicators for each perspective, establish targets that are ambitious but feasible and define the initiatives needed to close the gap. Include both leading indicators of capability or process and lagging indicators of outcome.
Assign an accountable owner to each strategic theme and use the scorecard to monitor progress. Review the map when evidence contradicts a link or the strategy changes; do not preserve an attractive diagram after its assumptions have failed.
Final analysis
Strategy maps are valuable because they compress a strategy’s operating logic onto one page. By making the proposed drivers and relationships explicit, they support communication, accountability and implementation through the balanced scorecard.
A weak map merely stacks the four perspectives. The value lies in the causal hypotheses among them and in the management discussion used to test those hypotheses. Even then, a map does not choose the strategy. It cannot generate an answer to the organisation’s competitive challenge. It can operationalise a selected strategy—or compare the feasibility and economics of competing themes—but strategic choice must come from analysis and judgement outside the diagram.
Top practical tip
Write every arrow as a testable “if–then” statement and attach an indicator or review question that can show whether the assumed relationship is occurring.
Top pitfall
Do not use a strategy map to avoid making strategy. A polished chain of objectives cannot compensate for an unclear customer choice or weak competitive position.
Further reading
Kaplan, R. and Norton, D. (2001) The Strategy-focused Organisation: How Balanced Scorecard Companies Thrive in the New Business Environment. Boston: Harvard Business School Press.
Kaplan, R. and Norton, D. (2004) Strategy Maps: Converting Intangible Assets into Tangible Outcomes. Boston: Harvard Business School Press.